

MAP Local Guides - Local Search Grid
What is a Local Search Grid?
The Local Search Grid can show you where your business is ranking on a more granular level. Instead of giving you an overall ranking for your whole city, the grid shows where you rank from one neighbourhood to the next.
How do I understand a Local Search Grid report?
Once complete, a Local Search Grid report will look something like this.
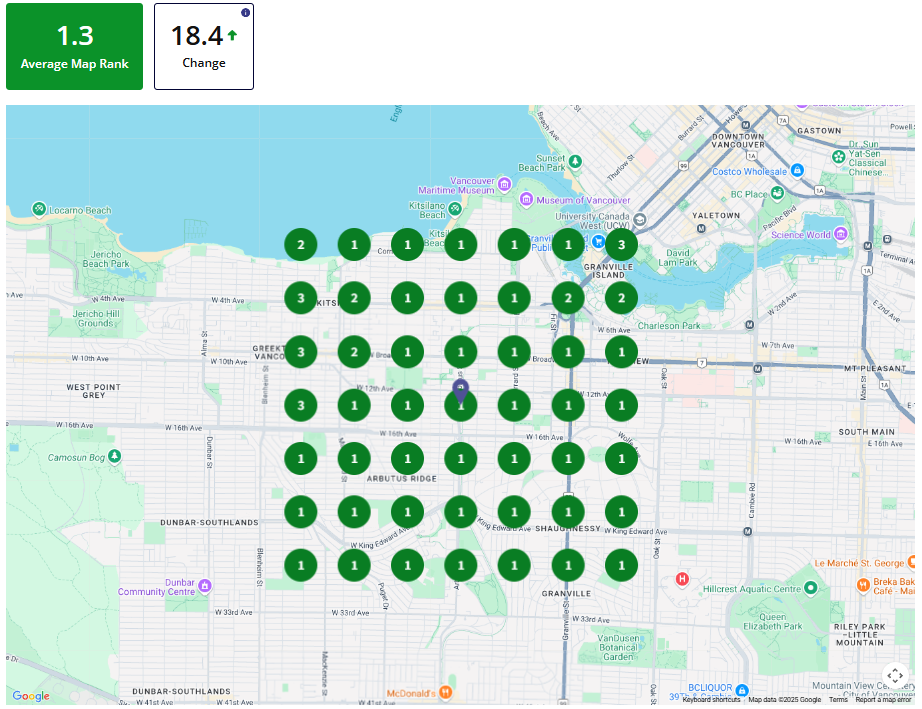
Above your search grid report you will see your 'average map rank' which is calculated to give you an aggregate total of your rankings. You will also see the change in ranking position since the previous report run.
When you look at the map itself you will find coloured circles indicating your position for each given area on the map. Green for positions 1-3, orange for positions 4-10, and red for positions 10+. Hovering over an individual point will show who your top competitors are for each one. You can also click the grid points, and the pop-up will appear, giving you further details on your competitors, such as their proximity to your business and how many reviews they have.
If you see the letters NF here they stand for ‘Not Found’. This means that Google was unable to find your business in the top 20 results for this grid point. If your business isn’t in the top 20 results but we have more than one page, we will show it as a dash.
Below the map is a table that provides more details about your competitors and how they stack up. This table will provide the following details about each competitor:
- Business Name
- Backlinks (Links)
- Authority
- Reviews
- Rating
- Primary Category
- Additional Categories
For a side-by-side comparison and to see a competitor's rankings on a grid, click on a competitor's name in the table.
Finally, the map below the table shows you where the competitors in the table are situated, so you can see how close they actually are.
More Integrated Marketing Insights from CCC